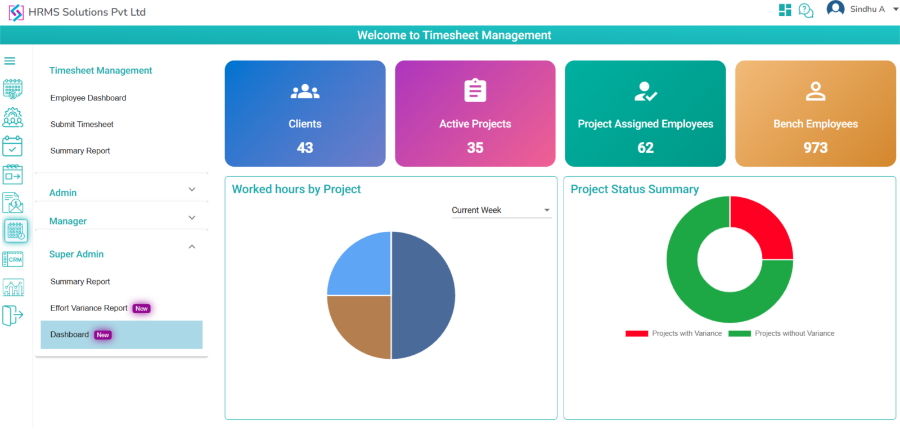
In Super Admin Dashboard, Clients, Active Projects, Project Assigned Employees, Bench Employees count will be displayed
In Worked hours by project, pie chart will be displayed along with Projects and hours.
In Project Status Summary, Donut chat will be displayed along with Project with Variance and Project without Variance count.
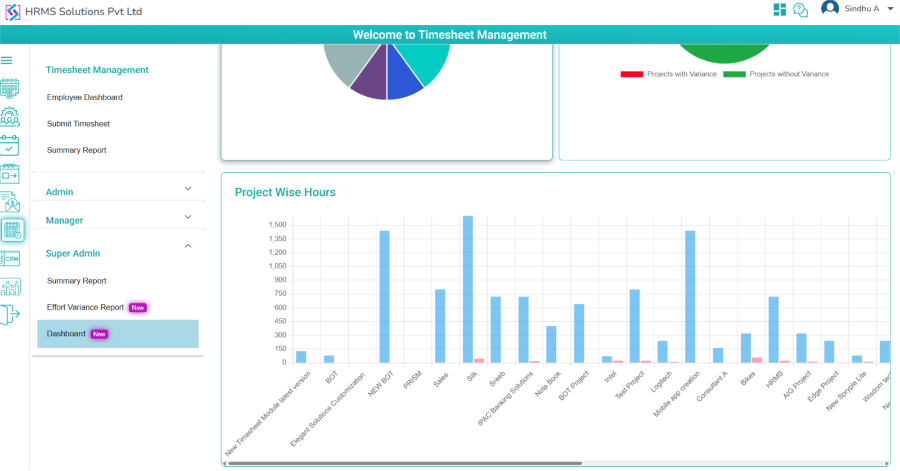
In Project Wise Hours, Bar chart will be displayed, for each project two bars will be displayed one is Estimated Hours with count and another one is Consumed Hours with count
Worked hours by project, Project Status Summary, Project Wise Hours data will be displayed based on the Date dropdown selection
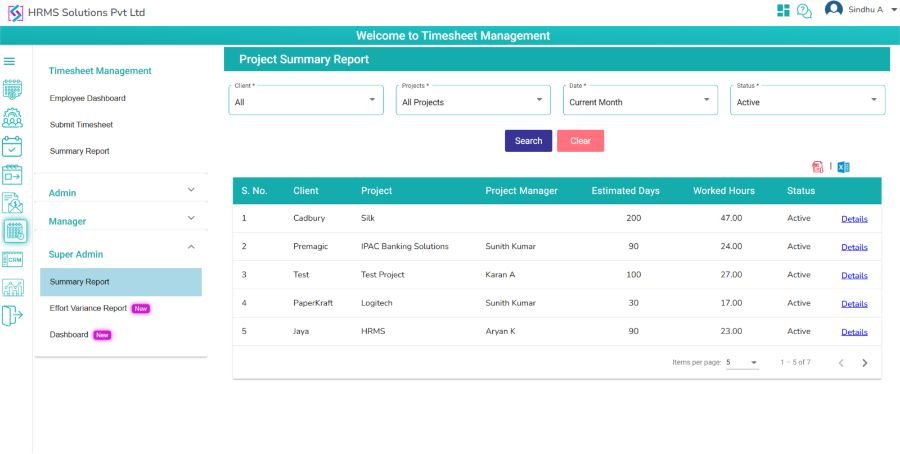
2. Summary Report
In Summary Reports, ‘Client’, ‘Project’, ‘Date’ and ‘Status’ dropdowns will be displayed, along with ‘Search’ and ‘Clear’ buttons.
Super Admin can download reports for the chosen dates in both Excel and PDF formats by clicking on the respective Excel and PDF icons.
On click Details hyper link, popup will be displayed with details.
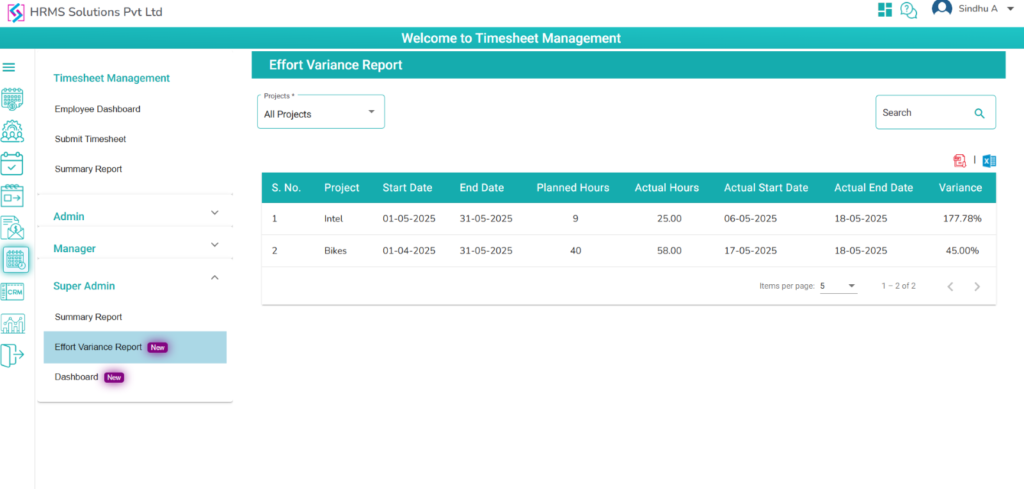
3. Effort Variance Report
In Effort Variance Report, ‘Project’ dropdown will be displayed, along with the ’Search’ box.
A Search box will be displayed at the top right of the table.
Super Admin can search for any Employee details in the table as needed.
Super Admin can download reports for the chosen dates in both Excel and PDF formats by clicking on the respective Excel and PDF icons.
Variance will be displayed based on planned hours and actual hours variance